


Full Portfolio Review: Current Value: $53,000
Welcome to COMPOUND TOWN!

I stole the name “Compound Town” from Conor over at Investment Talk (you should totally subscribe… just don’t stop reading my newsletter, thanks). Okay fine, he gave me permission to use it but it sounds cooler if I say I stole it.
Let me know in the comments or hit reply to the email me to let me know if you like the new name.
This week I consolidated the portfolio considerably. I am not recommending anyone do what I’m doing. A more concentrated portfolio can be far riskier.
The focus of today’s email is to show the entire portfolio, display how the multiples have changed for the companies I own, and share what returns MIGHT look like in the future based on current expectations.
The portfolio has received $63,491 in contributions and is down $10,527 leaving us at a current value of $52,963 which is down 17%. The screenshot below says down 39% because it calculates Money Weighted Return.

The portfolio needs to gain roughly 20% to get back to even from here. So in this market, I should be back to even by 2050…..just kidding (I hope).
My initial plan/goal was to start with $10,000 and contribute $3k/month from 2022 - 2032 for a total contribution of $370,000. At that pace, I would have contributed roughly $19,000 by this point. However, the market had a different plan and tech stocks (especially the stocks I like to own) dropped to levels that I personally believe present fantastic buying opportunities so I crammed as much money as I could into the portfolio and we’re now $44,000 ahead of schedule.
That could have been a terrible mistake… time will tell.
Has the Market Bottomed?
I have no idea. There are a lot of doomsday headlines out there. I am still of the opinion that this is a normal, healthy pull back in the general markets and that anything considered “growth” has sold off indiscriminately and more significantly. Let me explain…
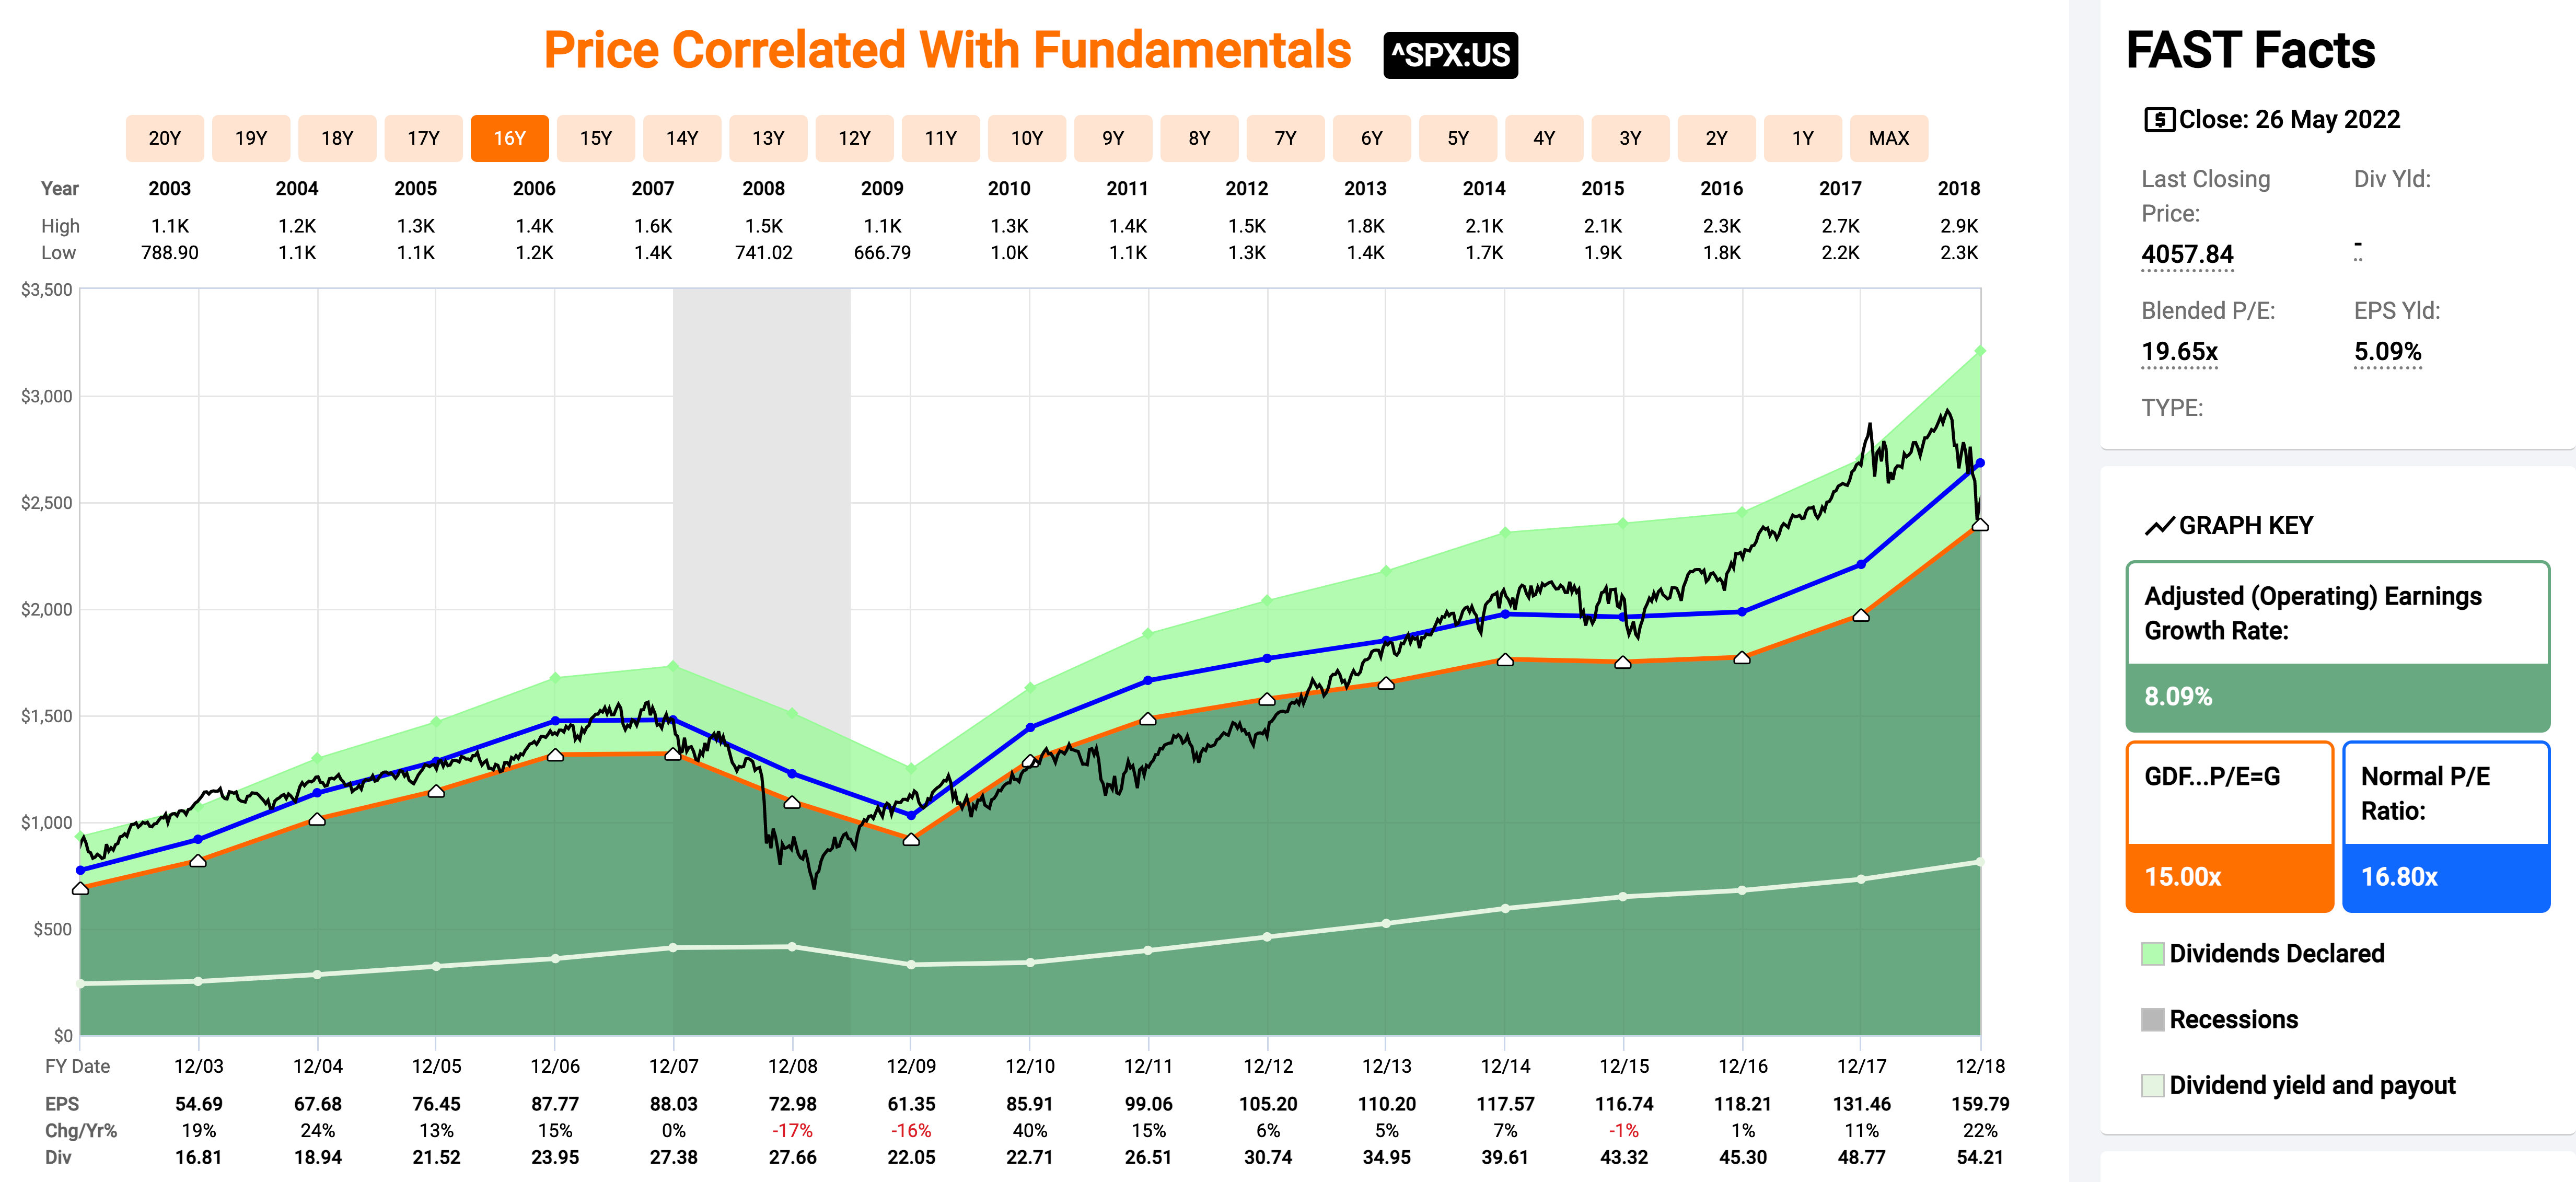
Below is a Fastgraphs chart of the S&P500 from 2002 - 2018. I consider this a pretty “normal” timeframe. If you look at the right side “Graph Key” you can see the Adjusted Earnings growth rate over that period was 8% per year and the “normal P/E” was 16.8 represented by the blue line on the chart.
If you look at the Fast Facts box on the right side you can see the current Blended P/E of the S&P500 is 19.65. So I wouldn’t be surprised if the broader index sells off another 10% - 20%.
One could certainly argue that we’re entering a recession and earnings are going to disappoint. That’s certainly possible. Below is a chart showing analyst expectations for S&P500 earnings in Calendar year 22 and CY 23. Analysts are expecting 1.4% and 9.12% growth respectively. In the block box below, I have shown the potential downside for the S&P 500 if the P/E drops from 19.65 to 16.5 by the end of 2022. We’re looking at roughly 14% downside.

Why am I talking about the S&P 500 when I’m focused on owning the best growth stocks? Well, I really don’t care too deeply about the S&P 500 but IF the general consensus is that the entire market is over priced and we’re entering a bad recession then it could bring the S&P500 and all stocks down with it. So it’s something to be aware of.
HOWEVER
I think shares of some of the best tech/software companies of our generation have sold off AHEAD of the broader market because of the macro fears we’ve seen in the headlines.
Lets take a look at all of the companies in Compound Town. We’re going to focus on how much the next-twelve-months enterprise value / revenues have compressed since July and what analysts’ future expectations are.
Snowflake (SNOW) Enterprise Value $35B
NTM EV/R has contracted from 58 in July to 16 today with 46% expected revenue CAGR from FY 2023 - FY 2027.

If SNOW hits $9.2B in revenue in FY 27 and has an EV/R of 10 (down from 16 today), then the enterprise value would be $92 billion, a 162% increase from today’s prices.
That’s a CAGR of roughly 21%. Is this a guarantee? No so let’s apply a 25% buffer on each side.
In that case, the low would be an EV of $69 billion and a high of $115 billion. That gives us a potential 5 year return of 97% - 228%.
This could still be way off, but I think there’s a decent probability that SNOW has an EV between $69 billion and $115 billion at the end of FY 2027 (calendar year 2026). Because I am obviously bullish on the stock, I think there’s a strong chance it ends up at the high end of that range giving us a CAGR of ~26%.
Because of Snowflake’s dominant results to date, excellent management team, and fortess balance sheet, I view it as having a relatively low risk of total failure.
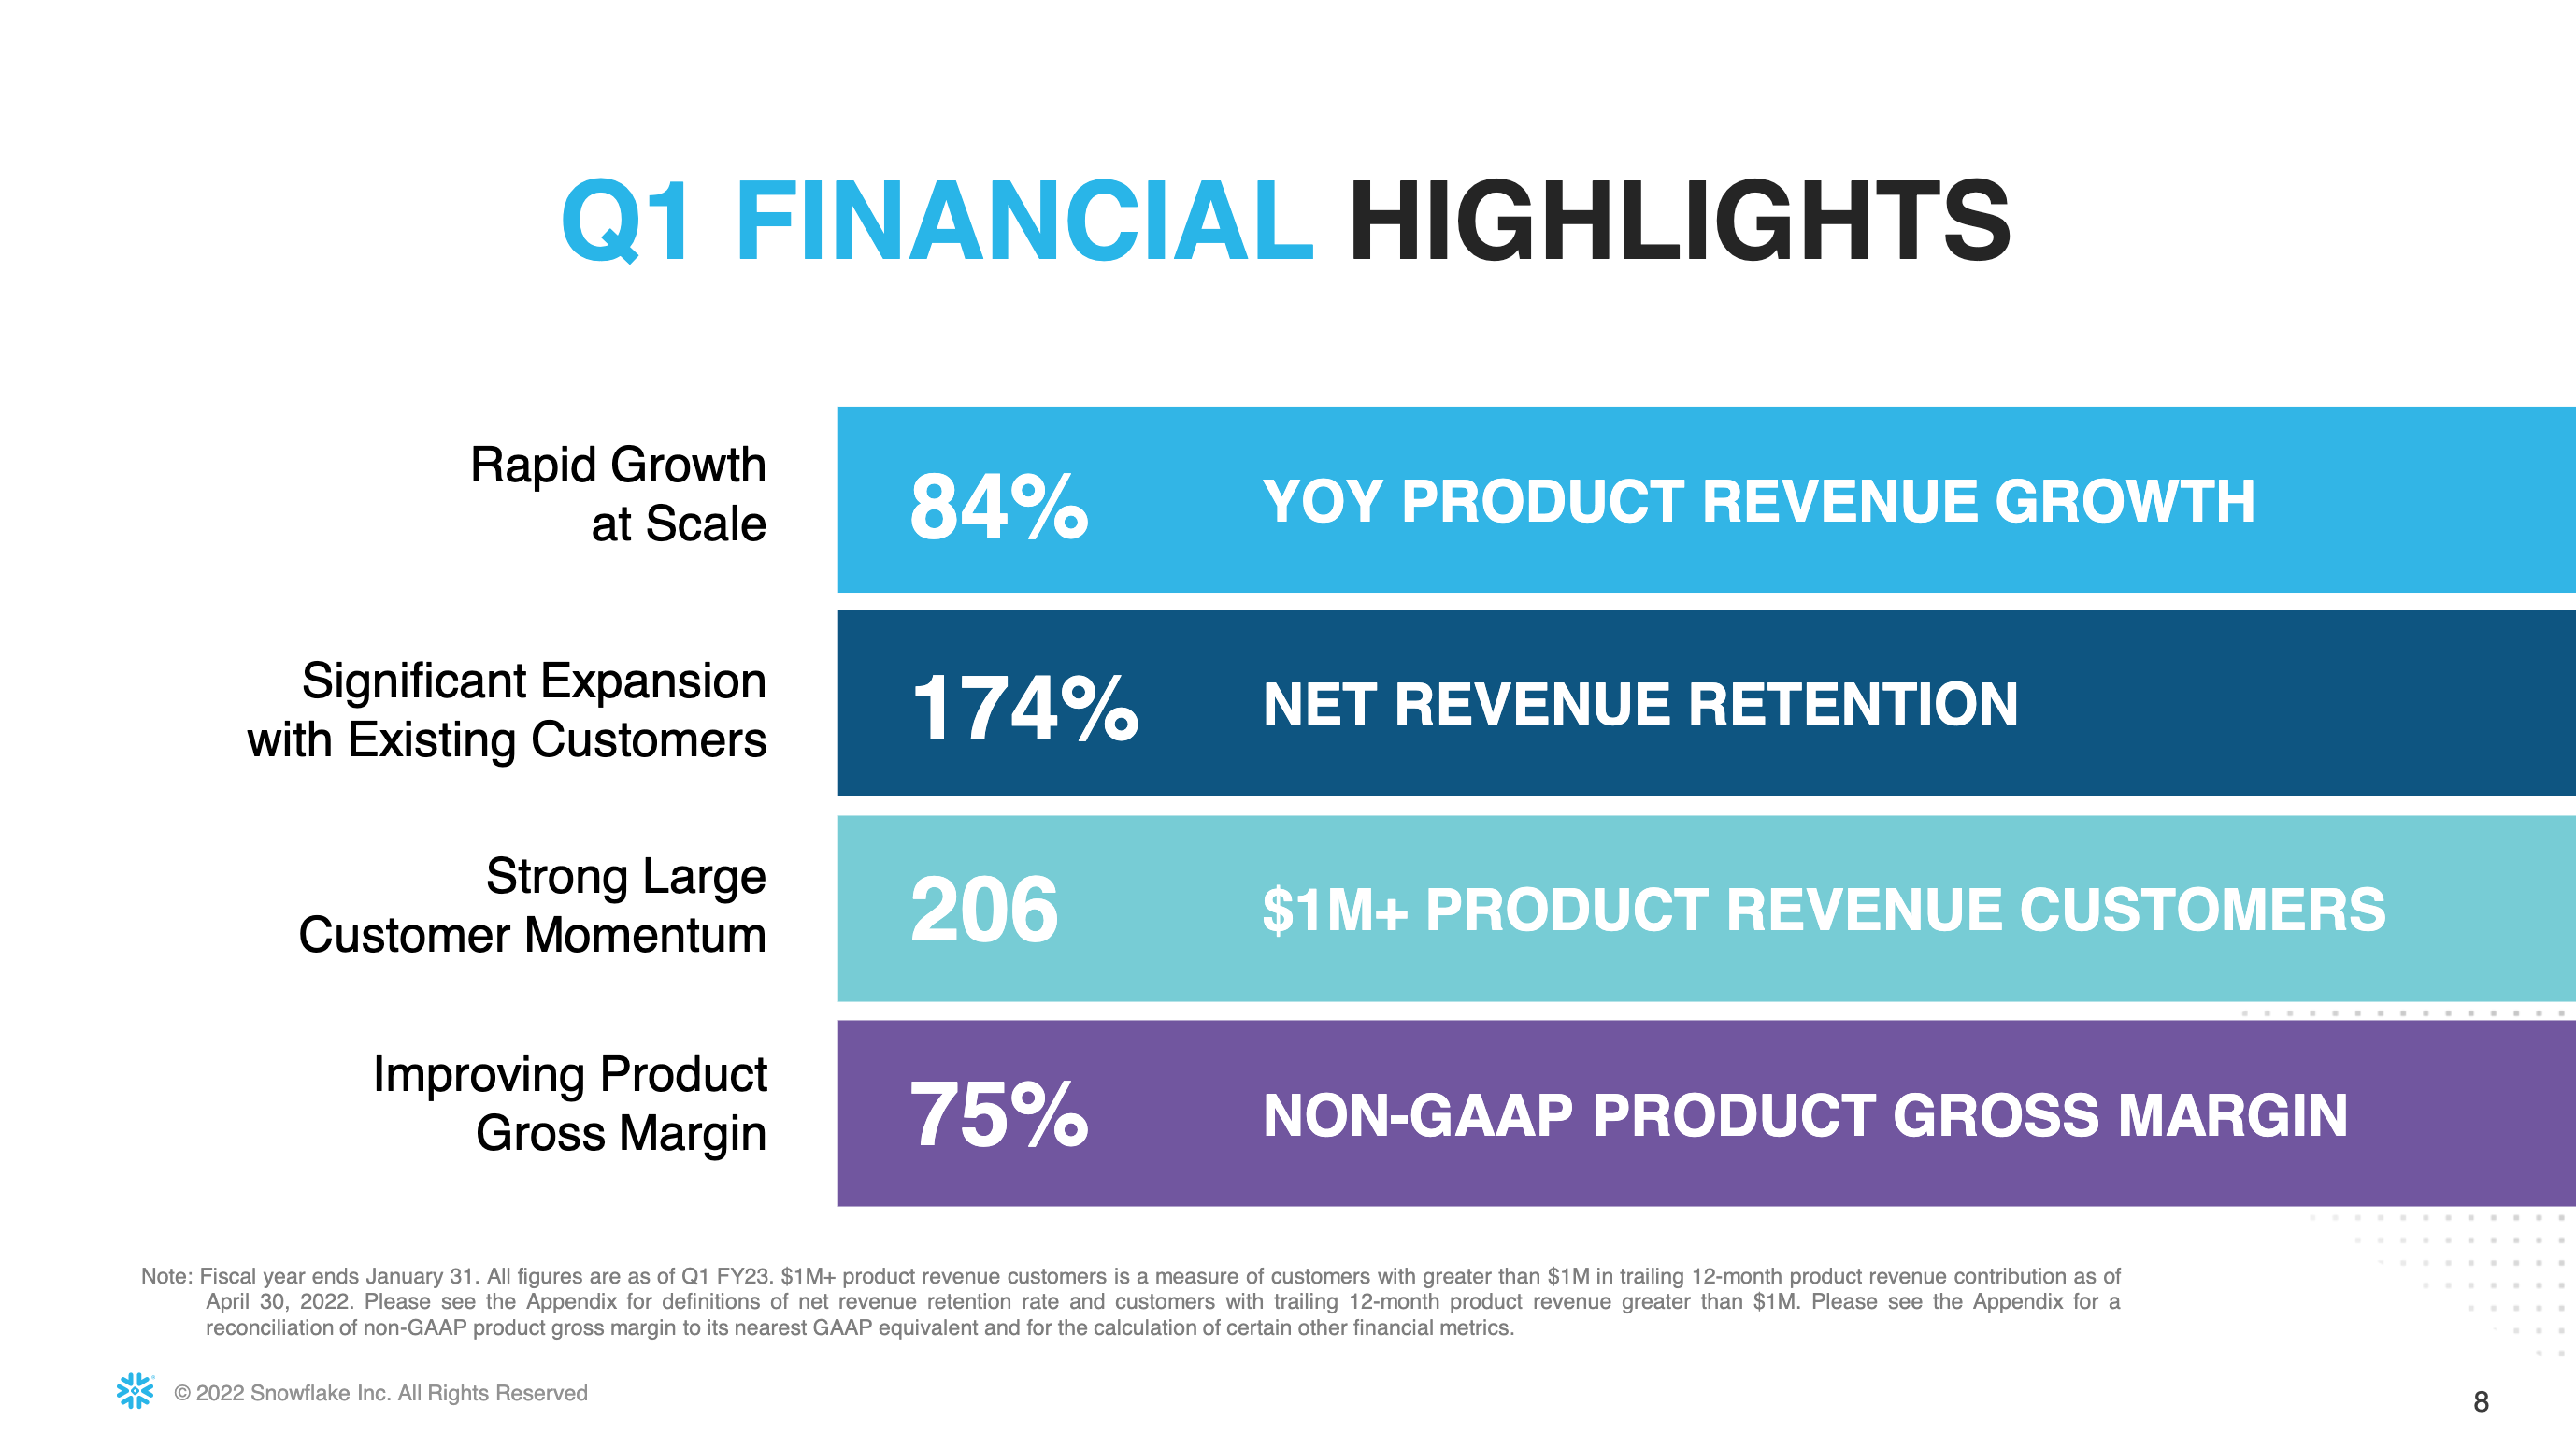
Snowflake reported Q1 FY 2023 earnings this week and I felt great about their numbers (slides below). Very few companies earning over $1B in annual revenue have ever grown as fast as Snowflake.
Management also updated their targets for FY 29. They left the revenue target at $10 billion (I think that will prove to be conservative) but they increased Non-GAAP Operating Income Margin from 10% previously to 20% and Non-GAAP Adj Free Cash Flow from 15% to 25%. Great signs that they’re seeing more proof of efficiency at scale.

Keep reading with a 7-day free trial
Subscribe to Growth Curve By Austin Lieberman to keep reading this post and get 7 days of free access to the full post archives.